Excel Data Analysis - Tables
Excel Data Analysis - Tables
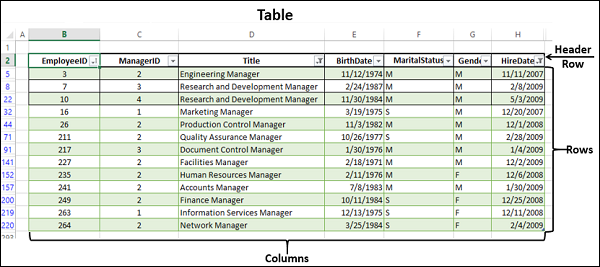
A Table is a rectangular range of structured data. The key features are −
-
Each row in the table corresponds to a single record of the data. Example - Employee information.
-
Each column contains a specific piece of information. Exmaple - The columns can contain data such as name, employee number, hire date, salary, department, etc.
-
The top row describes the information contained in each column and is referred to as header row.
-
Each entry in the top row is referred to as column header.
You can create and use an Excel table to manage and analyze data easily. Further, with Excel Tables you get built-in Filtering, Sorting, and Row Shading that ease your reporting activities.
Further, Excel responds to the actions performed on a table intelligently. For example, you have a formula in a column or you have created a chart based on the data in the table. When you add more data to the table (i.e., more rows), Excel extends the formula to the new data and the chart expands automatically.
Difference between Tables and Ranges
Following are the differences between a table and range −
- A table is a more structured way of working with data than a range.
- You can convert a range into a table and Excel automatically provides −
- a Table Name
- Column Header Names
- Formatting to the Data (Cell Color and Font Color) for better Visualization
Tables provide additional features that are not available for ranges. These are −
-
Excel provides table tools in the ribbon ranging from properties to styles.
-
Excel automatically provides a Filter button in each column header to sort the data or filter the table such that only rows that meet your defined criteria are displayed.
-
If you have multiple rows in a table, and you scroll down the sheet so that the header row disappears, the column letters in the worksheet are replaced by the table headers.
-
When you place a formula in any cell in a column of the table, it gets propagated to all the cells in that column.
-
You can use table name and column header names in the formulas, without having to use cell references or creating range names.
-
You can extend the table size by adding more rows or more columns by clicking and dragging the small triangular control at the lower-right corner of the lower-right cell.
-
You can create and use slicers for a table for filtering data.
You will learn about all these Features in this Chapter.
Create Table
To create a table from the data you have on the worksheet, follow the given steps −
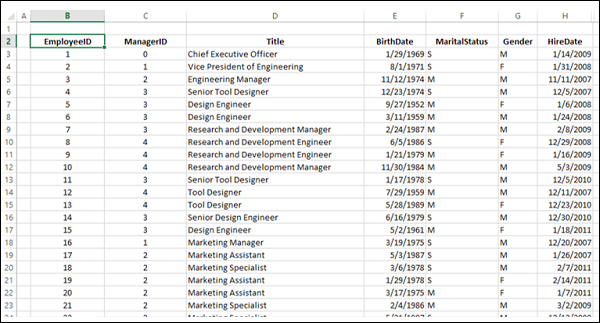
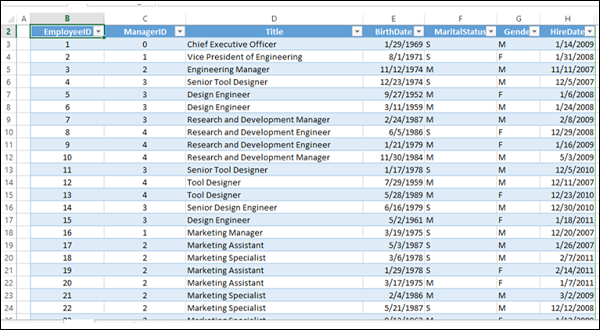
Step 1 − Select the Range of Cells that you want to include in the Table. Cells can contain data or can be empty. The following Range has 290 rows of employee data. The top row of the data has headers.
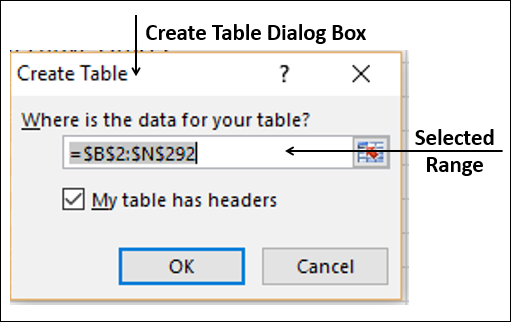
Step 2 − Under the Insert tab, in the Tables group, click Tables. The Create Table dialog box appears. Check that the data range selected in the Where is the data for your table? Box is correct.
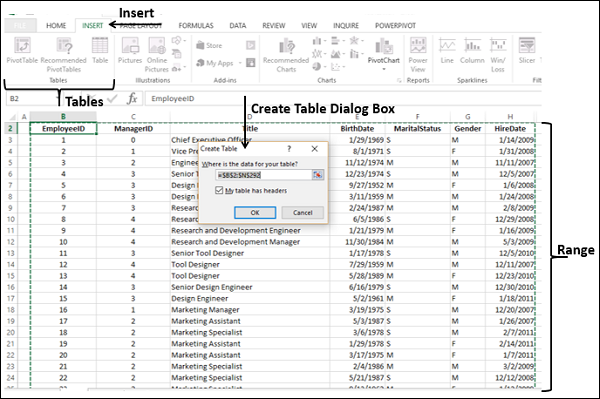
Step 3 − Check the My table has headers box if the top row of the selected Range contains data that you want to use as the Table Headers.
Note − If you do not check this box, your table will have Headers – Column1, Column2, …
Step 4 − Click OK.
Range is converted to Table with the default Style.
Step 5 − You can also convert a range to a table by clicking anywhere on the range and pressing Ctrl+T. A Create Table dialog box appears and then you can repeat the steps as given above.
Table Name
Excel assigns a name to every table that is created.
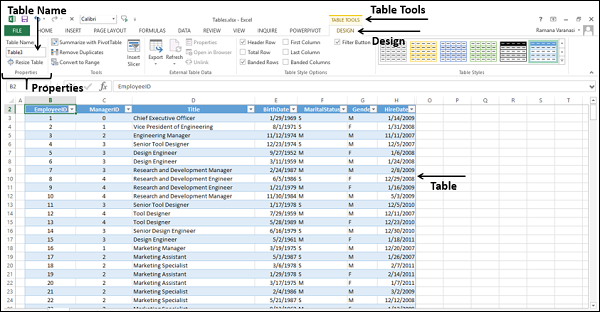
Step 1 − To look at the name of the table you just created, click table, click on table tools – design tab on the Ribbon.
Step 2 − In the Properties group, in the Table Name box, your Table Name will be displayed.
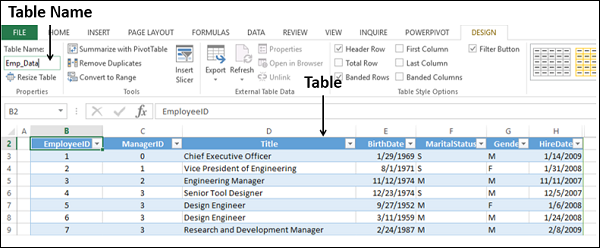
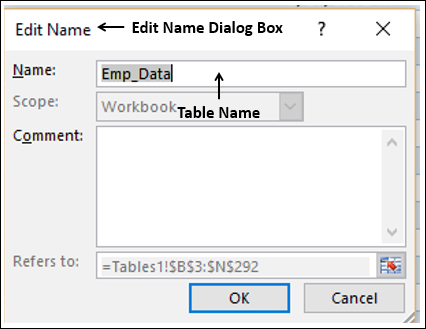
Step 3 − You can edit this Table Name to make it more meaningful to your data.
Step 4 − Click the Table Name box. Clear the Name and type Emp_Data.
Note − The syntax rules of range names are applicable to table names.
Managing Names in a Table
You can manage table names just similar to how you manage range names with Name Manager.
-
Click the Table.
-
Click Name Manager in the Defined Names group on Formulas tab.
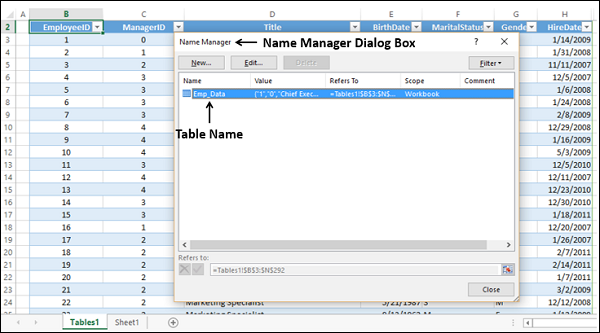
The Name Manager dialog box appears and you can find the Table Names in your workbook.
You can Edit a Table Name or add a comment with New option in the Name Manager dialog box. However, you cannot change the range in Refers to.
You can Create Names with column headers to use them in formulas, charts, etc.
-
Click the Column Header EmployeeID in the Table.
-
Click Name Manager.
-
Click New in the Name Manager dialog box.
The New Name dialog box appears.
In the Name box, you can find the Column Header, and in the Refers to box,you will find Emp_Data[[#Headers],[EmployeeID]].
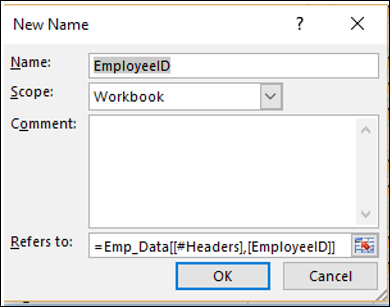
As you observe, this is a quick way of defining Names in a Table.
Table Headers replacing Column Letters
When you are working with more number of rows of data in a table, you may have to scroll down to look at the data in those rows.
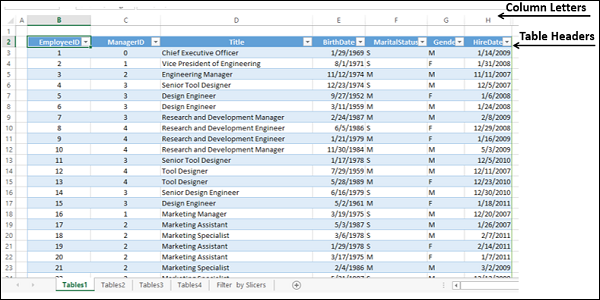
However, while doing so, you also require the table headers to identify which value belongs to which column. Excel automatically provides a smooth way of doing this. As you scroll down your data, the column letters of the worksheet themselves get converted to table headers.
In the worksheet given below, the column letters are appearing as they are and the table headers are in row 2. 21 rows of 290 rows of data are visible.
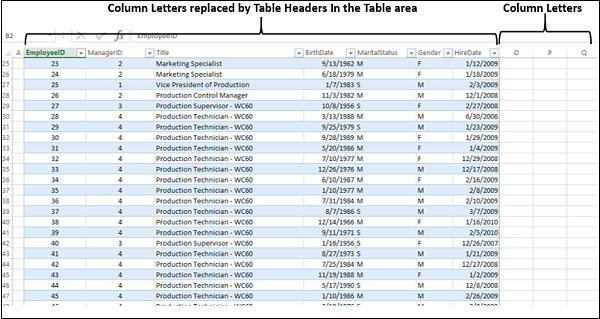
Scroll down to see the table rows 25 – 35. The table headers will replace the column letters for the table columns. Other column letters remain as they are.
Propagation of a Formula in a Table
In the table given below, suppose you want to include the age of each employee.
Step 1 − Insert a column to the right of the column Birthdate. Type Age in the Column Header.
Step 2 − In any of the Cells in that empty column, type the Formula, =DAYS ([@BirthDate], TODAY ()) and Press Enter.
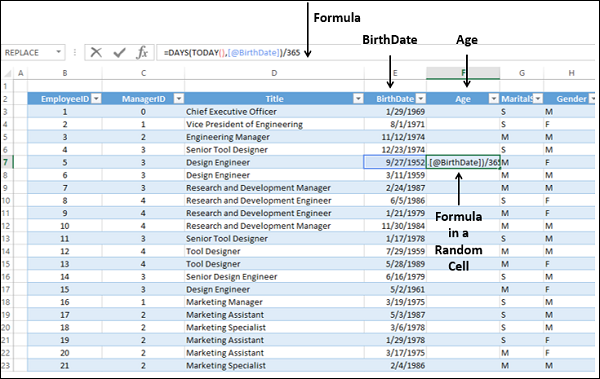
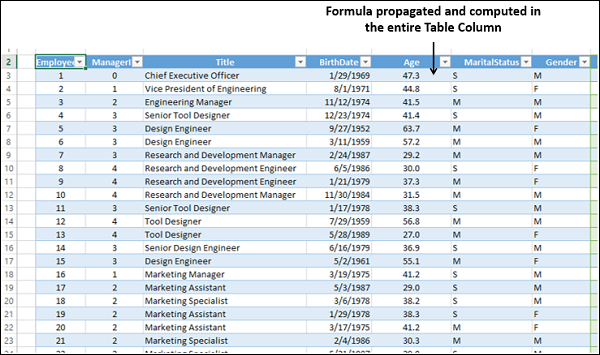
The formula propagates automatically to the other cells in that column of the table.
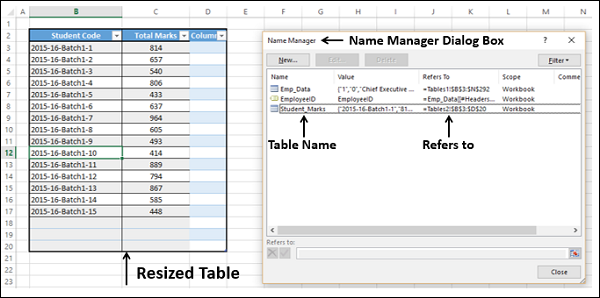
Resize Table
You can resize a table to add or remove rows/columns.
Consider the following table Student_Marks that contains Total Marks for Batches 1 - 15.
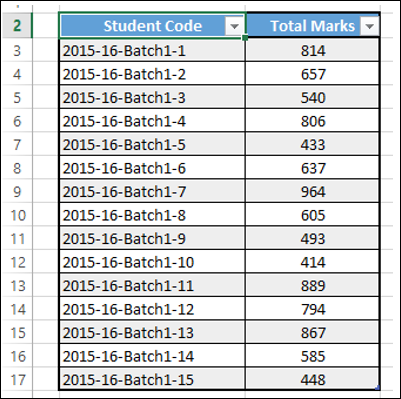
Suppose you want to add three more batches 16 – 18 and a column containing pass percentage.
-
Click the table.
-
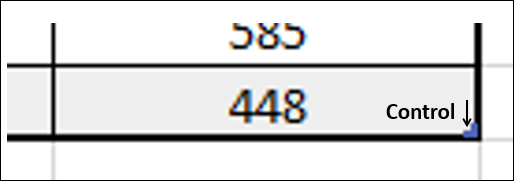
Drag the blue-color control at the lower-right, downwards to include three more rows in the table.
-
Again drag the blue-color control at the lower-right, sideways to include one more column in the table.
Your table looks as follows. You can also check the range included in the table in the Name Manager dialog box −
Remove Duplicates
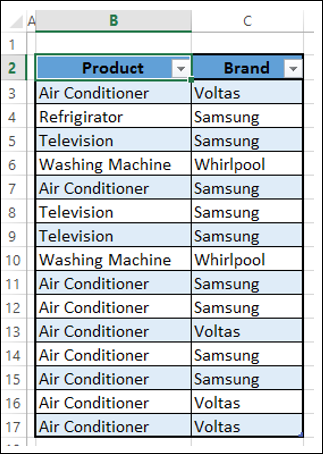
When you gather data from different sources, you probably can have duplicate values. You need to remove the duplicate values before going further with analysis.
Look at the following data where you have information about various products of various brands. Suppose, you want to remove duplicates from this data.
-
Click the table.
-
On the DESIGN tab, click Remove Duplicates in the Tools group on the Ribbon. The Remove Duplicates dialog box appears.
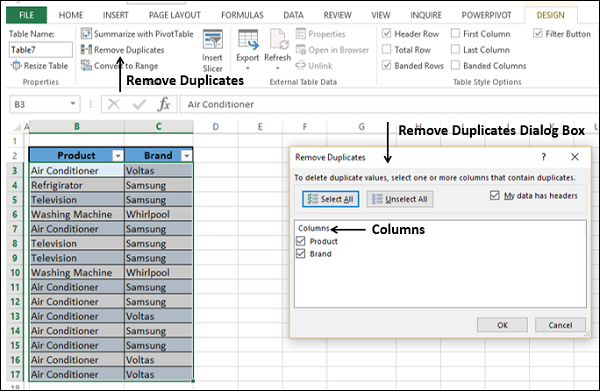
The column headers appear under columns in the Remove Duplicates dialog box.
-
Check the column headers depending on which column you want to remove the duplicates and click OK.
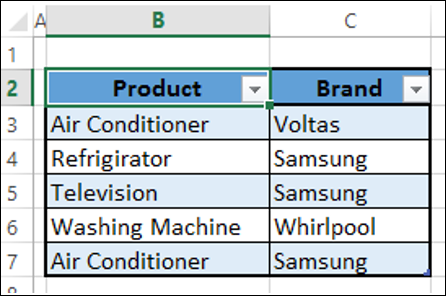
You will get a message on how many rows with duplicate values are removed and how many unique values remain. The cleaned data will be displayed in the table.
You can also remove duplicates with Remove Duplicates in the Data Tools group under DATA tab on the Ribbon.
Convert to Range
You can convert a table to a Range.
-
Click the table.
-
Click Convert to Range in the Tools group, under the Design tab on the Ribbon.
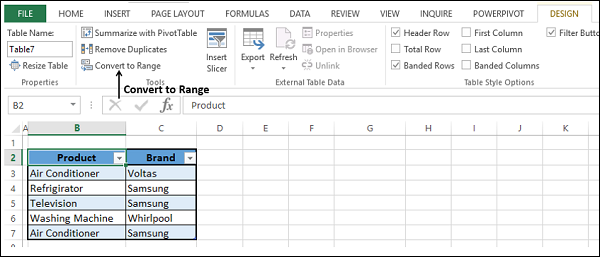
You will get a message asking you if you want to convert the table to a Range. After you confirm with Yes, the table will be converted to Range.
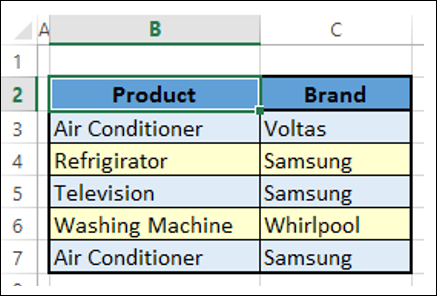
Table Style Options
You have several options of Table Styles to choose. These options can be used if you need to highlight a Row / Column.
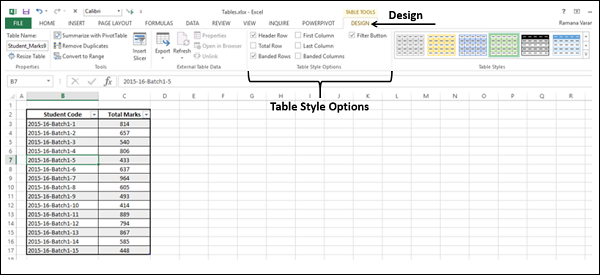
You can check / uncheck these boxes to see how your table looks. Finally, you can decide on what options suit your data.
It is advised that the Table Style Options be used only to project important information in your data rather than making it colorful, which is not needed in data analysis.
Table Styles
You have several table styles to choose from. These styles can be used depending on what color and pattern you want to display your data in the table.
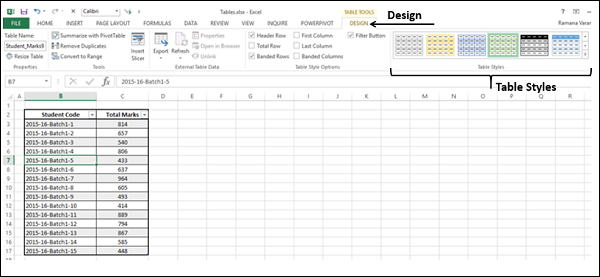
Move your mouse on these styles to have a preview of your table with the styles. Finally, you can decide on what style suit your data.
It is advised that the Table Styles be used only to project important information in your data in a presentable way rather than making it colorful, which is not needed in data analysis.
Slicers for Tables
If you are using Excel 2013 or Excel 2016, you can use Slicers for filtering data in your table.
For details on how to use Slicers for Tables, refer the chapter on Filtering in this tutorial.
Frequently Asked Questions
Recommended Posts:
- Excel Data Analysis Tutorial
- Data Analysis - Overview
- Excel Data Analysis - Inquire
- Advanced Data Analysis - Overview
- Advanced Data Analysis - Data Consolidation
- Advanced Data Analysis - What-If Analysis
- What-If Analysis with Data Tables
- What-If Analysis with Scenario Manager
- What-If Analysis with Goal Seek
- Optimization with Excel Solver
- Importing Data into Excel
- Advanced Data Analysis - Data Model
- Exploring Data with PivotTables
- Exploring Data with Powerpivot
- Exploring Data with Power View